
DEMOGRAPHICS & ECONOMIC ANALYSIS
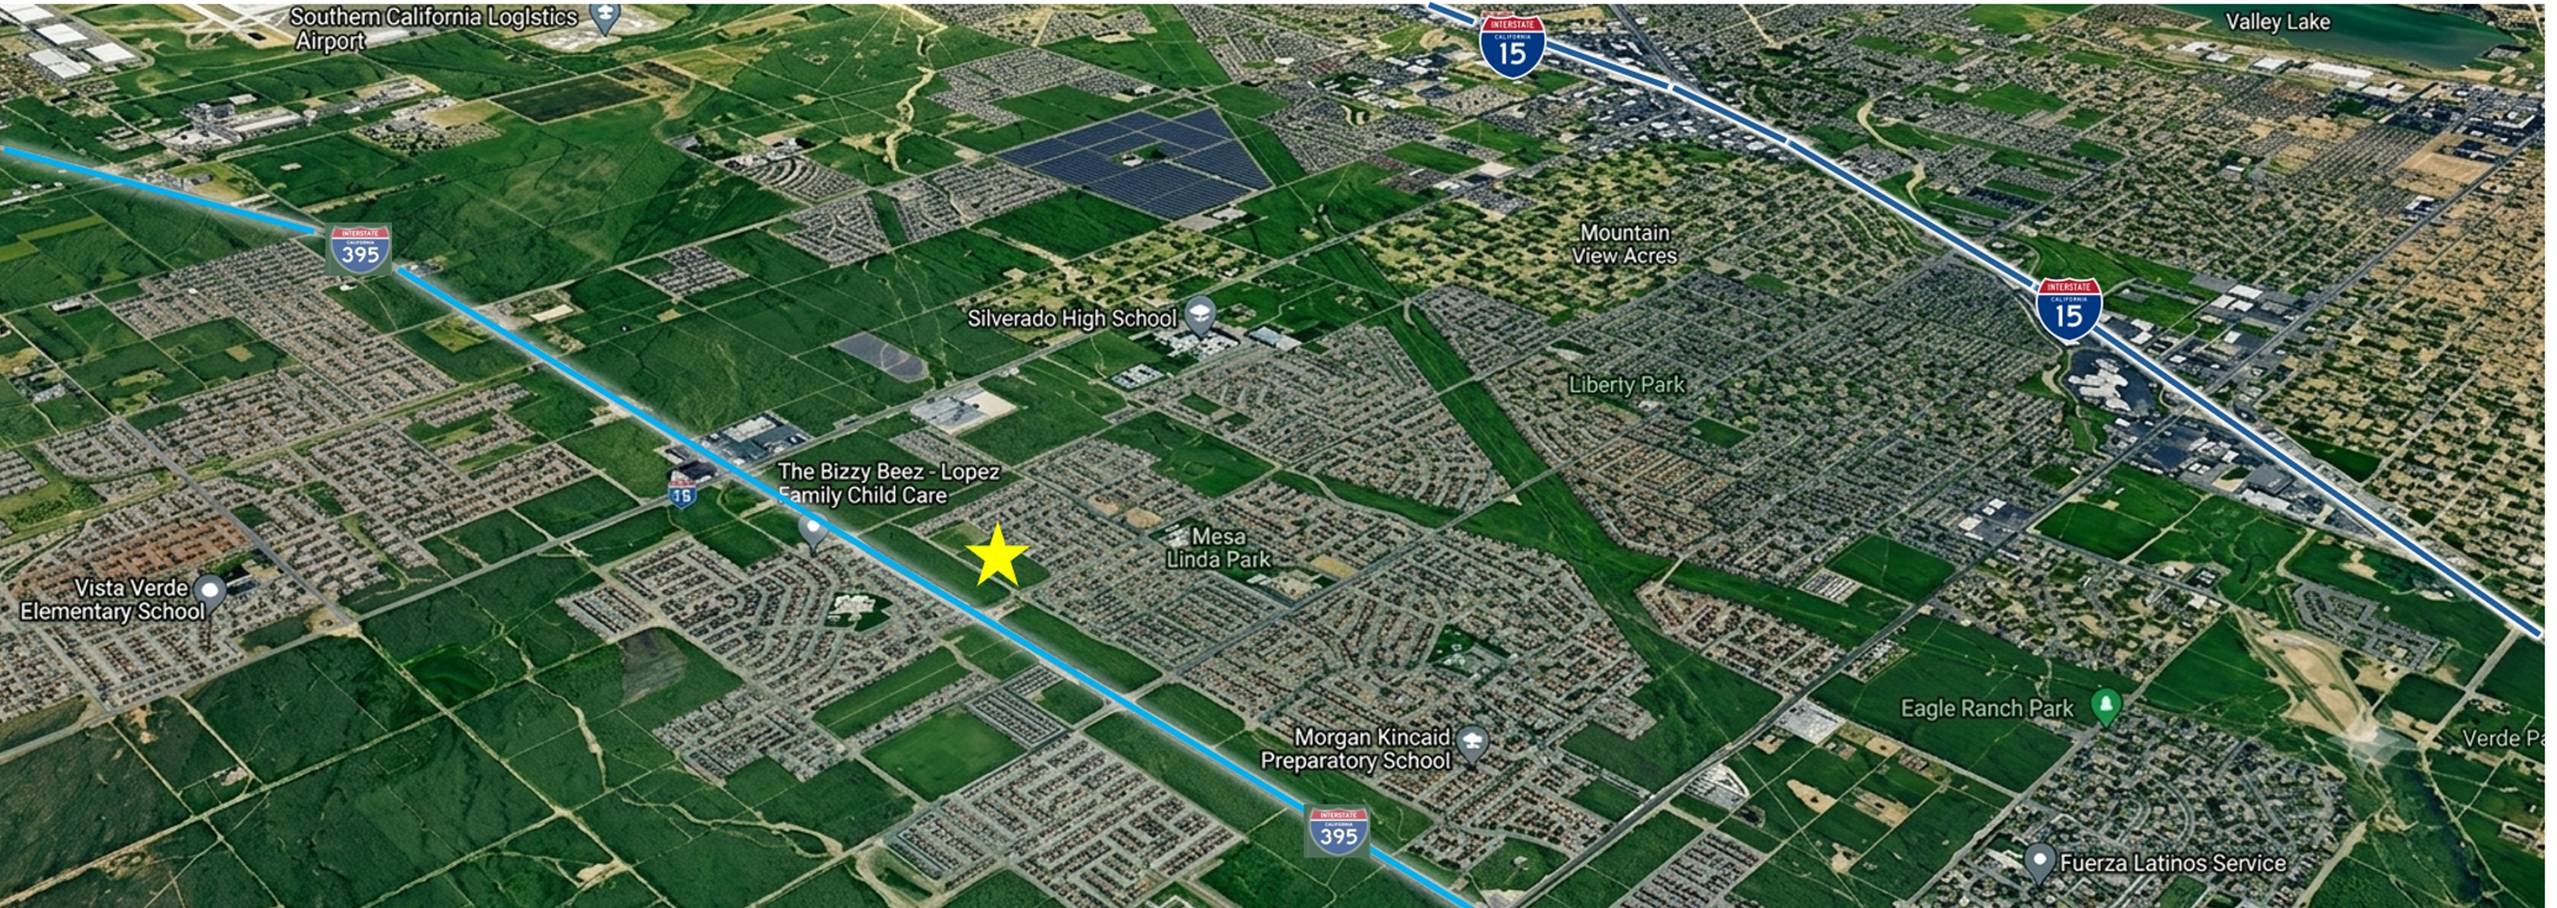
The site also provides convenient access to Interstate 15 within approximately five (5) miles, supporting strong commuter connectivity.
Key community amenities:
• Mesa Linda Park – less than 1 mile
• Liberty Park – approximately 2.3 miles
• Vista Elementary School – approximately 0.6 miles
• Silverado High School – approximately 2 miles
• Larrea Middle School – approximately 1.7 miles
• Cobalt Institute of Math and Science – approximately 1.4 miles
• Hawk Stadium – approximately 2 miles
• Theodore Vick School – approximately 3 miles
• Columbia Middle School – approximately 3 miles
Top Employers (Victorville)
• Southern California Logistics Airport – major logistics/industrial employer
• Victor Valley College – large education employer
• Desert Valley Hospital – regional healthcare facility
• Verizon – telecom employer
• Victor Valley Union High School District – education
• Victor Elementary School District – education
• Federal Correctional Complex, Victorville (including USP & FCI) – significant federal jobs
• Walmart – retail & distribution • Victor Valley Community Hospital – healthcare
Market Overview
Victorville & San Bernardino County Economic Profile
- Population: County ~2.2M; Victorville ~140k
- Labor force, employment sectors, median income
- Growth trends, affordability analysis
Housing Market Analysis
- Median home values: Victorville ~$350k–$450k
- Homeownership rate: Victorville ~58–60%
- Market absorption and demand for for-sale townhomes
Sources: U.S. Census Bureau, ACS, EDD, Redfin, Zillow, County/City Reports.
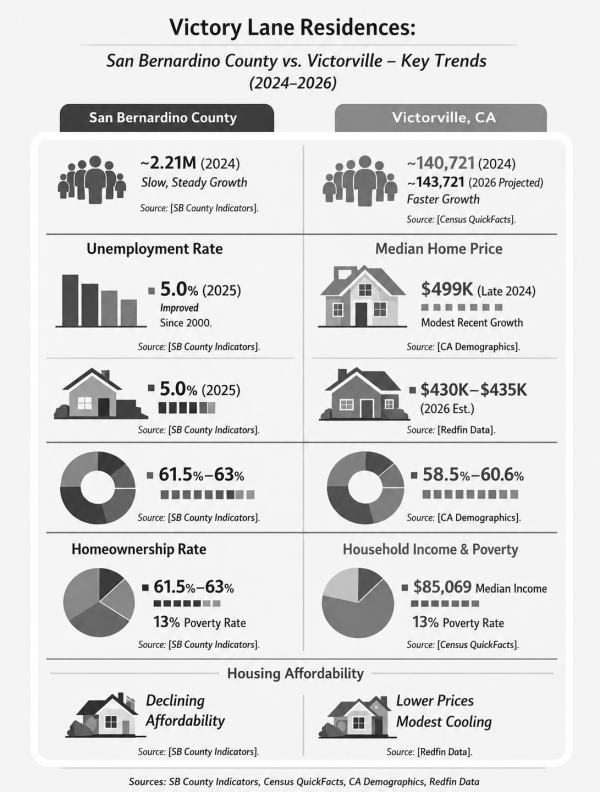
TREND COMPARISON
San Bernardino County vs Victorville Metric
Metric
San Bernardino County (Trend)
Victorville, CA (Trend)
Population (2020 → 2024/26)
~2.18 M (2024) — modest growth since 2020.
~115,903 (2010) → ~140,721 (2024) → ~143,721 projected (2026). (indicators.sbcounty.gov)
Population Growth Rate
Slow, steady growth throughout early 2020s. (indicators.sbcounty.gov)
Moderate growth (~1.05-1.2% annually). (World Population Review)
Unemployment & Labor Force
~5.0% unemployment (2025) with labor force rising. (indicators.sbcounty.gov)
Victorville has historically higher unemployment than county average (est. ~6-7% regionally). (Note: city data varies by source and current ACS data is limited). (California Demographics)
Median Home Price (Trend)
County median existing home price ~ $499 K (late 2024). (indicators.sbcounty.gov)
Median home price ~ $430 K-$435 K in early 2026 (modest year-over-year growth). (Redfin)
Homeownership Rate (Trend)
Homeownership rate has generally ticked up over the decade. (County QuickFacts reflects low-to-mid 60s). (indicators.sbcounty.gov)
Victorville homeownership ~ 58.5-60.6% (recent estimates). (California Demographics)
Housing Affordability
Affordability has declined as prices rose over 2015–2024, yet remains more affordable than coastal CA. (See county plan and indicator summaries.) (indicators.sbcounty.gov)
Victorville prices remain lower than county/regional averages; slightly cooling trend in recent data. (Redfin)
Household Income & Poverty (Trend)
Median household income ~$85,069 (2023) and overall poverty ~13.1%. (indicators.sbcounty.gov)
Median household income ~ $70,663 (2019-23 ACS); poverty ~ 19.9%. (Census.gov)
TREND COMPARISON
San Bernardino County vs Victorville Metric
Metric
San Bernardino County
Victorville (City)
Population (latest)
~2,214,000 (2024 est.) (indicators.sbcounty.gov)
~140,721 (2024) (Census.gov) Households
Households
~694,301 (indicators.sbcounty.gov)
~37,480 (2019-23 ACS) (Census.gov)
Unemployment Rate
~5.0% (2025) (indicators.sbcounty.gov)
Higher relative city unemployment (varied estimates) (California Demographics)
Homeownership Rate
~61.5-63% (indicators.sbcounty.gov)
~58.5-60.6% (California Demographics)
Median Home Price (recent)
~$499 K (Q4 2024) (indicators.sbcounty.gov)
~$430 K-$435 K (Jan 2026) (Redfin)
Median Household Income
~$85,069 (2023) (indicators.sbcounty.gov)
~$70,663 (2019-23 ACS) (Census.gov)
Recent Home Price Growth
Strong increases over last decade (county prices up significantly) (indicators.sbcounty.gov)
Long-term increase since 2000; modest recent year-over-year growth. (World Population Review)